
BTC mining corporations are extremely important for the future of Bitcoin, as a currency, ecosystem, and store of value.
Continue readingBTC mining corporations are extremely important for the future of Bitcoin, as a currency, ecosystem, and store of value.
Continue reading
In this article I want to share more about my strategy for crypto investments and why you are still early by investing now in 2022.
Continue reading
The market crash is a GREAT time to buy assets at a much better price. History shows that after a market crash always come a period of growth.
Continue reading
Before we get into it, if you are expecting yet another article about the HOTTEST token project – you’re on the wrong blog! Time to look at different investment strategies in crypto currencies.
Yes, I do have a few token projects in my crypto currencies portfolio, of course (I will share more about this in another article). But the reason why I decided to step into crypto is more fundamental than that and it covers the entire ecosystem needed to make crypto currencies even possible in the first place.
Did you know, for example, that you can invest into crypto currencies without having to buy a single one of them? (How does this even make any sense?)
Hang in there, it’ll all become clear in a second. Let’s get into it.
Disclaimer – this article is by no means a recommendation. I am sharing my views and opinion on a very volatile and unpredictable market. References to price levels or past buy/sell orders are not financial advice and solely based on my research.
Before we explore investment strategies in crypto stuff, it’s time for a quick 101.
It’s gonna sound cliché AF, but let’s start with the most known crypto currency – Bitcoin.
Bitcoin is nothing other than a new payment method that removes the need for “the middleman”. Who is the middleman? A central organization that approves your transactions, holds your money, has insight in what you do with your money and most of all controls its value. I am obviously talking about the broad banking system.
In the normal system, you hold your money in a bank account. Imagine you want to transfer me €10, what do you do? Nowadays, you open your bank app, type the amount, select my contact details, hit send and voilá – money is transferred.
But there’s some magic happening between you hitting send and me receiving the money. This magic box that allows you to send me money involves a number of parties, which I got to know and study very closely in my work as a consultant in the financial technology sector, but at the core it, we have the banks.
Our banks have 100% insight in our transactions. And if we go one step higher, the central bank has 100% control on the value and amount of money present in the market.
Yes, I know, I cut a bunch of corners, but in its essence, our current system is CENTRALIZED (let’s start getting into some terminology here). In a centralized system, there is one party, or a selected few, who act as trusted party in a transaction.
Generally speaking, the blockchain technology is an alternative to centralized systems. In the particular case of money transfers, Bitcoin is the alternative to the centralized banking system as we know it now.
How does it work? And where do the coins come in the picture?
Time to talk about a very important player in the Bitcoin network: the miner. And not just one, 200.000+ of them, creating the Bitcoin network.
The miners are the ones approving your Bitcoin transactions. The Bitcoin network (protocol) is built such that a given number of transactions is coded in a block for the miners to approve.
When a miner approves a block, it receives a reward… in Bitcoins!
And that’s the ONLY mechanism to issue new Bitcoins for a total of 21 million.
This reward is programmed to half every set number of blocks. For Bitcoins, it comes down to one halving event every 4 years. The last one was in 2020 and it brought down the reward to 6.25 BTC for every approved block of transactions. Given the increase in valuation of the past years, this has been a massive investment strategy from the miners’ perspective.
*Quick Note Before We Move On*
Since your transactions are approved by (most likely) different miners within the network, no one party holds 100% of your data. The transactions are anonymously registered in the Bitcoin network history (through wallet ID only) which makes it impossible to derive individual patterns without knowing someone’s wallet ID. By scanning the network, however, one can derive global trends which are still valuable and do not infringe any data protection law we’ve ever thought of as humans.
Bottom line: you are in charge of your own data. This is the essence of the DECENTRALIZED system. And this is not just for payments; you can apply this line of thinking in a lot more industries.
The reward system built in the Bitcoin network protocol is a CRUCIAL point for the sustainability of the miners’ business model. At this moment, the miners are earning rewards and a transaction fee. As I explained, the rewards will get lower and lower (since they drop 50% every year), which means that to sustain their operations the transaction fee is likely to raise. This mechanism should (on the long term) stabilize the value of the Bitcoin; or any other coin based on this protocol.
Halving events have made the news because they were the main driver behind the ridiculous increases in price we have seen in past years.
Why?
Well, since miners know the halving time (remember – it’s just programmed in the network and the information is publicly available!) they increase their volume right before it. This will temporarily lower the coin price since new coins are issued relatively fast. When the halving happens, there is an instant drop in the number of coins available. This creates scarcity in the market and a motivation for investors to jump in, fueled by fear of missing out. This fear is also made much more tangible by the media massively focusing on it around halving events.
But this is not what will change the market in the coming months. Like I said, the Bitcoin halving event has already happened in 2020. The next one will be in 2024 (check the countdown here on Coin Market Cap) but before that, there’s an additional dynamic that made me even more enthusiastic about investing in the crypto market right now.
Bitcoin miners have found themselves in a pretty though spot so far. Bitcoin hasn’t really had a good name in the investor community due to all the allegations around being the go-to currency for money laundering schemes and all sorts of illegal trafficking activities.
Without venture capital or any kind of fresh traditional investment capital coming in this market, miners have had to rely SOLELY on the BTC rewards!
In other words, miners have been using the (now) 6.25 BTC reward to pay salaries, operations, data centers, etc. and to scale their operations. Don’t forget that being every miner, there’s a whole company to be sustained!
I have seen that most of the mined Bitcoins where immediately put back into the market to provide miners with the liquidity they needed to run operations.
However…
And here, we are moving closer to what I think will be the turning point.
However, this situation is slowly changing as traditional investors are starting to step in. With more investment money flowing in on the balance sheets, the miners have close to no reason to sell their Bitcoins.
This movement is not mainstream yet, otherwise you’d hear it everywhere on the news, but you can see it in some little things happening in the market (if you know where to look) and especially on the miners’ balance sheets.
An example of these dynamics is the “Bitcoin Retention Program” just launched by Cipher Mining Technology which allowed them to increase their Bitcoin assets to 76%.
Looking at 2020-year reports, you see retention percentages going from 15% to 80% depending on the size of the individual miner.
Bottom line, here’s what I noticed:
So, back to the original teaser question. What IS this alternative investment strategy in crypto currencies? How can you invest in crypto without buying any one of them?…
You invest in the mining corporations.
And mining corporations are “just another one of those” stock listed companies you can analyse, valuate with “conventional” financial metrics. Check these two articles to get down to the numbers when looking at these companies: Owner Earnings Part 1 and Part 2.
I will be sharing more on this, talking about some mining corporations I find interesting, especially the ones at the forefront of sustainable mining (yeah, Elon was talking trash when he said that Bitcoin is heavy on the environment, it’s not that black and white after all).
One word of warning. As I have learned in my experience in the investment world so far, mentioning one of my mentors directly: when large, traditional institutional investors step into a market, it’s time to CASH OUT.
As these investors are slowly approaching the crypto market, being positioned correctly is very important. Do your work, invest what you can miss, and, most of all, don’t get greedy!
When you will read on the news that the stock exchange has hit a record numbers listing mining corporations, go check your position because it’ll most likely be time to cash. 😉
Stay up-to-date with the latest developments in the stock and crypto market., fund, and crypto market.
These are unqualified opinions, and this newsletter, is meant for informational purposes only. It is not meant to serve as investment advice. Please consult with your investment, tax, or legal advisor, and do your own research.

I was checking my blog again and I realized my last post was about a year ago. I left you with my assessment on American Express 2020 Stock Price back when the covid crisis hit the stock market and most of the stocks were on sale! Since then, so much happened: both great and bad investments, unexpected pay out from old ones and even a few total failures. Bottom line, if you were wondering whether I had given up on investment… well, hell no! I simply went under the radar. Why? I have no idea. I would have to think a bit longer to articulate that but back then it felt like the right thing to do.
So here I am, back at my desk, sharing what I learned on my way to financial freedom after a year investing, trading and rediscovering crypto currencies!
Disclaimer – this article is by no means a recommendation. I am sharing my views on investments I made in the past year. References to price levels or past buy/sell orders are not financial advice and do not take into consideration any current market conditions.
We have all heard the story: time = money.
We have all heard it and we have all somehow fallen for it by directly exchanging out time for money. This is not necessarily a bad thing… if you are genuinely content about the way your time is being used. The problem with this model is that your time is limited, and for as much as you can increase your hourly rate, your growth potential is relatively limited.
And don’t get me wrong, when you are starting out, you will inevitably start exchanging your time for money. But to grow, you need to think differently about how you spend your time. And more precisely, you want to spend your time creating assets that in turn will “work” for you.
So, once again, spend your time creating assets. And your assets will take care of the rest.
This is exactly why I invest.
PS: what will I do with all the extra time I free up, you ask? One thing at a time, I can only share so much in one article 😛
Gonna be honest with you: for long I had been just f-ing around with investing. Bought a little bit of that company, dumped some more in some other company, and never looked back at it anymore. That’s how I found myself buying Tesla (TSLA) when it was just $50, Ali Baba (BABA) and some other mainstream companies I liked.
Before what I call the Covid Sale, I wasn’t focused, and I didn’t have much of an investment strategy. I was early in the game, reading a bunch of different books on investments and trying stuff out on exchanges, online brokers, etc.
Despite my chaotic start in the investment world, I didn’t do that bad. I was lucky enough not to lose my money.
TBH, I did lose some on commissions and stuff like that – I wasn’t too handy with online broker accounts, didn’t understand much of the terminology and ended up losing some unnecessary money over a few trades.
A few months before Covid hit in March 2020 (in Europe), I had closed most of my random-ass online broker accounts and opened a decent one where I was going to start investing consistently. I chose a DEGIRO Custody Account – since I’m based in the Netherlands, this is the go-to platform if you wanna invest long-term. I can tell you more about how I came to this conclusion, or what other platforms are out there – especially if you’re into short-term trading strategies like scalping, swing, momentum, etc. You can do stuff like this in DEGIRO too, but you are not as flexible since it doesn’t allow partial ownership (in other words – you cannot buy 0,2425345 shares of Amazon, AMZN).
So, where were we. Covid hit, yeah. March 2020.
I had decided to start investing regularly in January 2020. Mostly dollar-averaging on S&P500 and starting to venture out in company valuations. Suddenly, March 2020 brought a BIG sale on the stock market. It was like shopping at Zara in the big sale after Christmas. Mayhem! Not for me tho. This was such as exciting moment when I saw most of the companies I was targeting and analyzing drop 10%, 15%, 20% and more. I managed to purchase S&5P500 (SPDR500) at $300, Uber at $18, Amex at $71!
Compounding is the mechanism of reinvesting capital gains for exponential (long-term) portfolio growth. In other words, you start investing €100, you gain €10, you reinvest €110 and so on and so forth.
The key in this story is: REINVEST.
What I had shared in this old article from May 2020 (Understanding Compound Interest) is not entirely true, I missed the essence of compounding and only covered the aspect of averaging to buy at different price levels so that on average you remain under market price on the long-term (assuming steady growth).
This realization came in hard. I realized that if I kept my positions long, I was NOT compounding. To do that, I had to reevaluate my portfolio and think of a system to cash out and reinvest my gains.
It is a lot more difficult than I thought, to be honest. My strategy was, and still is, the following: I pick an expected reward (guess work, here) like 10%, 15%, 20%, 30% – depending on the deal – evaluate my risk at the support (lowest level on the monthly chart). When the investment hits my target reward, I am out. For better and for worse. You’d think.
When that point comes, I’m telling you, sticking to your strategy is one of the most difficult emotional effort to do.
Your monkey mind (which I call Wario – like the evil version of Super Mario) starts making a lot of noise and a few times it took over, I didn’t sell, and messed up my whole investment because of that. I’ll talk about it in a second.
Similar trading strategy around company news you can pick up before they go mainstream. This one is before the Tesla event, and it went sour!
You might have heard of Wirecard AG, a German bank involved in a huge accounting scandal. Well, I bought some shares after the massive drop confident that it was a clear overreaction of the investor community, and that the German government would step in and fixed the mess.
I wasn’t familiar with trading strategies, risk/reward targets, etc., so I had blind faith in my assessment and went on investing in the company, expecting it to raise to pre-scandal valuation.
To my disappointment, I saw that stock triple in value (still didn’t sell – remember, I had no strategy) only to crash FAR below my entry point. The scandal turned out to be a lot more serious than I thought and the company got eventually delisted from the stock exchange.
I lost a solid 60% of my investment here. Learn my lessons. And moved on.
(This ended up well)
Beginning of Nov. 2020, I was browsing some of my usual sources of information – not talking about newspapers, but less user-friendly stuff like the Securities Exchange Commission filings etc. – and I see that they had formalized the decision of adding Tesla to the S&P500! This event was going to be announced on December 11th and finalized on December 21st. Sounds like a no brainer, right?
Learning my lessons from the Wirecard story, I layed out my trading strategy before stepping in. Support level was at -5% (meaning, I could have lost 5% if the stock value had dropped below the monthly chart), and I had set my target reward at 20%. I bought.
December 11 news gets out that Tesla was going to be listed. Market gets hyped. December 16th Tesla rises to 26% and that’s when I sold again – actually realizing the 26% profits.
TBH, I could have sold a few days before that, when it hit 20-22%. But I needed time to calm screaming Wario down and stick to my investment strategy. For better and for worse.
In this case it went GREAT for me. Yes, Tesla rose more than just 26%. But it doesn’t matter. For all I knew, I could have lost that as well. It is FAR more important to realize your profits and reinvest.
In all this madness, I had completely forgot about crypto and some old investments I had made back in 2017.
Again, in those years I was messing around with crypto currencies, simply buying what I thought it was cool. Leaving it in some vague-ass wallet. End of the story. I wasn’t much into the technology behind it and what it means for our future.
I was slapped back on my feet when I saw my DOGE skyrocket to $ 2400 out of the blue! From only $ 100 I had put in back in 2017. And it didn’t stop there.

And this is how I got back to crypto – for real this time.
This deserves a whole article, I’m afraid. So, hang on tight, and I’ll see you there!
Stay up-to-date with the latest developments in the stock and crypto market., fund, and crypto market.
These are unqualified opinions, and this newsletter, is meant for informational purposes only. It is not meant to serve as investment advice. Please consult with your investment, tax, or legal advisor, and do your own research.

As I promised you in my article series on Owner Earnings Part 1 and Part 2, I would share a full price estimation of an actual public-listed company. For today’s article I chose: American Express!
Disclaimer – this article is by no means a recommendation to buy/sell stocks of American Express. It is merely a means to share my views on the company, its business operations and position in the travel/hospitality and financial services industry, and finally my considerations on its financial positions (i.e., earnings and “fair” valuation).
To estimate a fair stock price based on Owner Earnings is important for you to get familiar with annual reports.
This is the place where you find all relevant financial and managerial information about the company you’re interested in. Annual reports are published by every public company as a duty towards their shareholders, who want to be brought up to speed with the latest developments and financial performance. The reports are usually published between 3 to 6 months after the end of a fiscal year (December 31). In other words, they give an overarching picture of what the company when through in a year time, and you as an investor get to take a look in the recent past at financial performance of the company you put your money in!
Of the annual report, I would recommend to read:
Of the pages of the annual report I shortlisted, here’s what you really need to estimate a fair stock price for the company you’re interested in:
With all this information collected from the annual report, you can now estimate the owner earnings, and a fair price you’d be willing to pay for the company. How? Like so.
Owner Earnings | = |
Pre-tax income | + |
Depreciation and amortization | + |
Account payables (net) | + |
Account receivables (net) | + |
Maintenance capex |
Note that some of these quantities may be negative!
Let’s run the numbers for American Express, and compare the estimate based on Owner Earnings to their market price of $109 as of June 7, 2020. The important question to keep in mind is – is that price high/low/in range compared to the company’s earnings?
I’m gonna go ahead now and open the Amex 2019 Annual Report, and I’m gonna show you where to find all the elements you need to calculate a fair estimate of the stock price. Not THE only price estimate out there, but a first one based on the company’s earnings.
What you need to know | Where you find it |
Pre-tax income | Consolidated Statements of Income, Page 79 |
Average common shares outstanding | Consolidated Statements of Income, Page 79 |
Depreciation and amortization | Consolidated Statements of Cash Flow, Page 82 |
Account payables and receivables | Consolidated Balance Sheets, Page 81 (Total Value) Consolidated Statements of Cash Flow, Page 82 (Net Value) Notes to Consolidated Statements, Page 84 – 132 |
Maintenance capex | Consolidated Statement of Cash Flow, Page 82 Notes to Consolidated Statements, Page 84 – 132 |
If you have no idea what these things are, check out my article on Owner Earnings Part 2 where I cover what each of these quantities are and why they are important for the calculation of a fair stock price.
This is the net income + income tax. You either do the sum yourself or you (sometimes) can actually find the Pretax Income already carried in the Consolidated Income Statements. And guess what? It’s your lucky day, because Amex has already given that.
$ 8,429 millions (that’s 8.4 BILLIONS!)
To make their statements easier to read, it is very common to shorten the numbers and approximate up to thousands or millions, depending on how much the company is generating. In Amex’s case, they round everything up to the millions.
This value is also in the Consolidated Income Statements on Page 79. In 2019, Amex issued:
828 million common shares
This is an average number, because during the year the amount of share might change due to buybacks, issuance of extra shares etc.
An average throughout the year is good enough.
Easy one, go to the Consolidated Statement of Cashflow on Page 82 and you’ll see Depreciation and Amortization being carried at:
$ 1,188 millions
Here’s my cheatsheet to estimate this value.
For now, you just need to know that Amex puts their Account Payables and Receivables in their Balance Sheets on Page 81. The net values are:
In accounting, a number indicated between brackets is a negative number which means it’s going OUT of your account.
Maintenance CAPEX are always the tricky part. I have a cheatsheet for you on my article on Owner Earning Part 2. I’ll keep it short for the sake of this discussion, the numbers you need are on the Consolidated Statement of Cash Flow on Page 82. In particular:
Finally, I can answer the question: what is a fair stock price for American Express?
Remember this is just ONE of the price estimates that you will do when assessing a company. This is one of the quickest because it is only based on what the company is earning NOW! It doesn’t require any historical data or detailed knowledge of the market to estimate growth rates etc. I’ll share these other methods later on my blog!
What you do now – you add up all the quantities I have just given you from the annual report and divide them for the average common shares.
Some of the numbers are negative! Adding a negative number means subtracting it. Don’t ask me why this s*#t is arranged this way haha
Here’s how you calculate it:
10 x Owner Earnings
Average Common Shares
This equals $84.31.
So what?
Well, Amex is selling now at $109. The price I’m willing to pay has to be lower than the one based on Owner Earnings. The criteria will be even clearer when I share the other pricing methods.
When I did my first estimate in February, Amex was trading at $71, because of the impulsive reactions of investors around the world to the onset of the corona crisis. And that’s when I bought it!
Little disclaimer here. Pricing considerations are not the only ones that drive an investment decision. They are crucial, because you wanna make sure you pay a fair value for the company. However, there are qualitative considerations (on the company, its position in the market and overall industry) that are just as important.
Stay up-to-date with the latest developments in the stock and crypto market., fund, and crypto market.
These are unqualified opinions, and this newsletter, is meant for informational purposes only. It is not meant to serve as investment advice. Please consult with your investment, tax, or legal advisor, and do your own research.

American Express. Yes. This is one of the companies I invested in, still own in my portfolio and am very excited about! Remember my previous articles on Owner Earnings Formula Part 1/2 and Part 2/2? Well, here we diving into American Express to get to know as much as we can about the company. The goal is not only to calculate a “fair” price for the company. At the same time, it is important to understand the company as a whole to put the price estimation in the right context.
Disclaimer – this article is by no means a recommendation to buy/sell stocks of American Express. It is merely a means to share my views on the company, its business operations and position in the travel/hospitality and financial services industry, and finally my considerations on its financial positions (i.e., earnings and “fair” valuation).
American Express (also called Amex) is a very old company, in business since 1850. Their presence in the market for 170 years is a proof of business resilience and her ability to adapt to an ever changing market demand in the travel/hospitality industry. Amex provides a wide range of services to the wealthy (medium to high tier) businessman on the go. Among said services, Amex clients can benefit from access to airport lounges, discounts at selected hotels, cashbacks, dispute handling services, business expenses management services and a number of insurance packages to cover all aspects of a trip.
The same services are also extended private-labelled to third-parties who are looking to offer the same level of hospitality to their customers. For example, KLM issues Amex-branded cards to her gold members who in turn benefit from premium services while traveling.
The revenue model is based on:
1. annual fees for cardholders (ranging from ca. EUR 60 to 700),
2. credit interest,
3. insurance,
4. transaction fees (since they are a payment network, just like Mastercard or VISA).
Amex competes in the global payments industry with card networks (i.e., Mastercard, Visa, JCB, China Union Pay, Discover Global Network and other small national networks), issuers and acquirers, paper-based transactions (e.g., cash and checks), bank transfer models (e.g., wire transfers, SEPA and Automated Clearing House, or ACH), as well as evolving and growing alternative payment and financing providers (Paypal, Venmo, Alipay, WeChat Pay). As the payments industry continues to evolve, Amex faces increasing competition from non-traditional players that leverage new technologies, business models and customer relationships to create payment or financing solutions.
Being a card issuer, Amex competes with financial institutions that issue general-purpose charge and credit cards and debit cards. They also encounter competition from businesses that issue their own private label cards, operate their own mobile wallets or extend credit to their customers. Amex faces intense competition for cobrand relationships, as both card issuer and network competitors have targeted key business partners with attractive value propositions.
The principal competitive factors that affect the card-issuing, merchant and network businesses include:
I think there are 2 BIG factors that give American Express a strong position in the travel/hospitality and financial services market.
First of all, Amex has a strong brand name associated with social status. Owning an Amex card is synonymous to wealth and premium services.
Second, due to the wide network of partners (airports, merchants, insurances etc.), the average Amex customer would not switch, nor cancel the card unless under very unlikely circumstances (e.g., extreme change in their personal financial situation).
Using Charlie Munger’s so called moats (the moat is the deep, wide ditch occasionally containing crocodiles 😛 you would find around a castle), Amex has a brand and switch moat. If you wanna know more about the moats, you can find a great, comprehensive explanation on Invested, written by Danielle Town (great investor, daughter of Phil Town, another great investor in this world!).
Here’s my summary of Amex financial position as of the latest data publicly available. You can find this information in their 2019 annual report. You can alternatively look at other consolidated filings on their investor relationship website, if interested.
$ in millions | 2019 | 2018 | 2017 | 2016 |
Net Revenue | $ 43,556 | $ 40,338 | $ 33,471 | $ 32,119 |
Expenses | $ 31,554 | $ 28,864 | $ 26,693 | $ 25,369 |
Pretax Income | $ 8,429 | $ 8,122 | $ 7,425 | $ 8,042 |
Net Income | $ 6,759 | $ 6,921 | $ 2,736 | $ 5,408 |
Profit Margin | 15 % | 17 % | 8 % | 17 % |
Return on Equity | 29.6 % | 33.5 % | 13.2 % | 25.8 % |
Return on Assets | 3.5 % | 3.8 % | 1.6 % | 3.4 % |
At this point, we are ready to take a deep dive into the 2019 annual report and determine a “fair” price for American Express. I will share the detailed estimation in a different article. In the meantime, get familiar with the pricing method called Owner Earnings, the one I shared in Owner Earnings Formula Part 1/2 and Owner Earnings Formula Part 2/2 and I’ll see you in the coming days to talk to you through it and apply it to Amex.
Stay up-to-date with the latest developments in the stock and crypto market., fund, and crypto market.
These are unqualified opinions, and this newsletter, is meant for informational purposes only. It is not meant to serve as investment advice. Please consult with your investment, tax, or legal advisor, and do your own research.

Compound interest is the single most important thing you wanna understand when you start investing. It’s the fundamental mechanism behind explosive growth, exponential growth, hockey stick curve or whatever you wanna call it.
Einstein himself called it the 8th wonder of the world.
So, what is compound interest? And why is it SO important for you to understand?
Let’s dive into it using Einstein’s favorite lab: your imagination.
Imagine you and your buddy are looking back 10 years in the financial history of a public company you bought and owned for that exact amount of time. For the sake of this discussion, let’s call it Mario Inc.
Mario Inc. prices fluctuated over the 10 year period. Ten years ago, the company sold at $100. After 10 years of ups and downs, its worth is still $100. For the sake of this example, I will assume its price moved as follows.
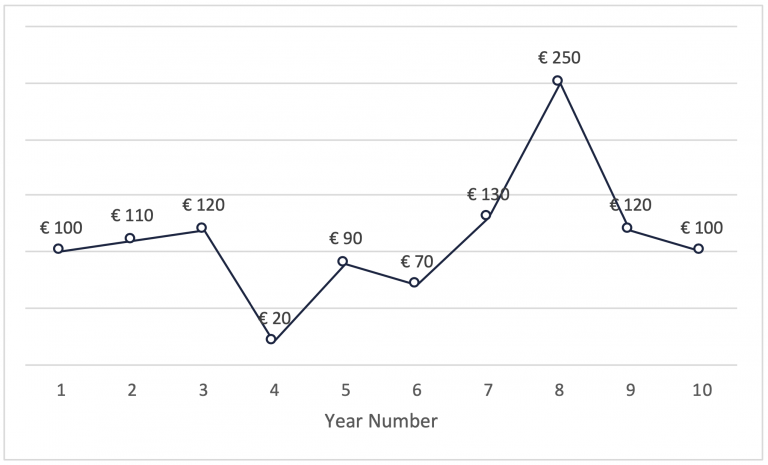
Given Mario Inc.’s price history, the important question is – how much money could you potentially make in 10 years, if the stock price doesn’t increase in Year 10 compared to Year 1? It might sound counter intuitive. However, even in this case you can tap in the power of compound interest.
It should be obvious that if you bought 1 stock in Year 1 and held it for 10 Years, nothing would change. You had €100 worth of stock in Year 1, you still have €100 worth of stocks in Year 10. No brainer.
Note – we’re assuming this particular company does NOT pay any dividends.
But let’s imagine that year after year, through the ups and downs, you buy 1 stock of Mario Inc. or equivalently around €100 worth of stocks if the price drops lower than that. How much would your stocks be worth after 10 years?
In this table below, I’m monitoring the investments every year and checking the year-on-year market value.
| What you invest per month | Stock Price | Number of Stocks | Total Invested | Value |
| € 100 | € 100 | 1 | € 100 | € 100 |
| € 110 | € 110 | 2 | € 210 | € 220 |
| € 120 | € 120 | 3 | € 330 | € 360 |
| € 100 | € 20 | 8 | € 430 | € 160 |
| € 90 | € 90 | 9 | € 520 | € 810 |
| € 70 | € 70 | 10 | € 590 | € 700 |
| € 130 | € 130 | 11 | € 720 | € 1.430 |
| € 250 | € 250 | 12 | € 970 | € 3.000 |
| € 120 | € 120 | 13 | € 1.090 | € 1.560 |
| € 100 | € 100 | 14 | € 1.190 | € 1.400 |
Here’s when things get interesting. After 10 years of buying religiously every year, your stocks are worth €1400, while you invested a total of €1190. This is a growth of 18%! While the market has actually dropped 17% (so, -17%) and this company’s performance has been quite bad over the years, to be honest.
Coming back to our original question on compound interest, note that in Year 4, the company’s stock dropped to €20, a typical drop a company would experience in a crisis the size of 2008-2010; one of those economic downturns that can push investors flat on their faces. Here’s the crazy things, in the example above you only invested €100 in Year 4. What if you had been more passive-aggressive and invested €1000 euro? Obviously, doing so implies you have enough reasons to believe the company will survive the crisis.
Well, if you had invested €1000 in Year 4, when the stock dropped to €20 losing 83% of its value, this is what would have happened to your returns in Year 10.
| What you invest per month | Stock Price | Number of Stocks | Total Invested | Value |
| € 100 | € 100 | 1 | € 100 | € 100 |
| € 110 | € 110 | 2 | € 210 | € 220 |
| € 120 | € 120 | 3 | € 330 | € 360 |
| € 1.000 | € 20 | 53 | € 1.330 | € 1.060 |
| € 90 | € 90 | 54 | € 1.420 | € 4.860 |
| € 70 | € 70 | 55 | € 1.490 | € 3.850 |
| € 130 | € 130 | 56 | € 1.620 | € 7.280 |
| € 250 | € 250 | 57 | € 1.870 | € 14.250 |
| € 120 | € 120 | 58 | € 1.990 | € 6.960 |
| € 100 | € 100 | 59 | € 2.090 | € 5.900 |
The worth of your stocks in Year 10 is €5900, compared to the total you invested of €2090. That is a growth of 183%!!!
By the way, in this example, there’s also an interesting selling opportunity in Year 8 when the prices inflated to €250. In which case you’d have hit a return of 662%. These are insane numbers.
To tap in the power of compound interest, it is important to:
Stay up-to-date with the latest developments in the stock and crypto market., fund, and crypto market.
These are unqualified opinions, and this newsletter, is meant for informational purposes only. It is not meant to serve as investment advice. Please consult with your investment, tax, or legal advisor, and do your own research.

Before sharing some of the investment books that got me started, let me start with a little premise here. There are two distinct styles of investing, which for simplicity I will call:
Trading involves holding on to a stock for the short-term and sell it for profits leveraging the daily/weekly oscillations in the market price. This involves a LOT of speculation around the company, its management, press releases etc. Trading comes in all different shapes and forms; from the individual investor spending 1-2 hours a day on the broker website trying to capitalize on the price differences, to a company investing 5 million EUR on a private antenna in Veurne, Belgium to send buy/sell request 5 microseconds faster and “beat” the market.
PS: I didn’t make this up. This actually happened. Check out this episode of a Dutch News Program called Zondag met Lubach. The show is in Dutch but Youtube nowadays has gotten pretty good at subtitling videos.
Buying a company is a different ballpark. This implies buying a stock acting and reasoning as if you owned the entire company. In other words, you are looking to understand the business, the industry and whether the price is fair or not; check my articles on the Owner Earnings Part 1 and Owner Earnings Formula Part 2 to get an idea of how pricing works. By doing so, you are buying company at a positive margin of safety. You buy enough of those, in uncorrelated industries, something good may happen to you. I’ll cover the concept of Margin of Safety in a separate article, because there’s a LOT to say about that.
Anyway, back to this blog post, the investment books that I’m gonna recommend here helped me understand the second type of investments better: as an owner of the company!
Let’s take a look at them. I’m discussing them in the same order I read them when I got started:

Admittedly this one was THE book that got me started on my investment journey. The funny thing is – this book isn’t about company financials AT ALL. It slowly introduces you to the importance of investing as a part of the overall development of your money mindset.
What is the money mindset?
For those of you who hear this terminology for the first time – your money mindset is the set of beliefs that were installed in your brain during your upbringing (mostly by family and other circumstances related to how and where you grew up).
Here’s an example. If you grew up in a family that constantly struggled with money no matter how hard everybody was working – the belief installed in your brain might (subconsciously) tell you that “money is hard to make” or that “money is evil” because maybe that is related to other unpleasant things that happened in your family because of the tension around the concept of money.
According to Tony, healing your relationship with money is the first step towards building a better one!
Where does investing come into the picture? Investing is the act of making money work for you. And a good relationship with money is the foundation of a successful investment journey. 🙂
Speaking of investments, this book also introduces you to some of the best investors of modern times, their strategies and best practices that can help the individual investor build his/her own financial freedom.
Amongst them you’ll be introduced to Warren Buffet (Berkshire Hathaway), Ray Dalio (Bridgewater Associates), David Swensen (Yale Endowment Fund) and many more. I’ll share some of their investment philosophies in the next books, since after this one, I went on reading most of the books written by those guys. On to the next one!

Hands down – one of the most important books on investments! This is the book that inspired generations of investors, including Warren Buffet, the greatest, most known and successful investor on modern times.
What is all the fuss about this book? Why is it so important?
This book defines an investment strategy called value investing. The whole idea behind it is the following – you invest in companies whose intrinsic value is higher than the market value. The intrinsic value of a company is related to its earnings, dividends, cash, assets and historical data. Ben Graham defines a total of 7 parameters he monitors before even remotely considering to make an investment. I’ll cover all 7 of them in a later article, I promise 😉
The definition of value investing can help you look at companies you love (and would like to support by becoming their shareholder) in a different way. There are slightly different flavors of this strategy, depending on how you define intrinsic value. I’ll give you some examples below:
Clarifying these two points will take some time and a new more articles which I’ll try to get to ASAP. In the meantime, get started with the Intelligent Investor by Ben Graham! And I’ll get back to you 😀

Principles was probably not meant to be an investment book, but more of a autobiography. Except, it’s Ray Dalio, and being an extremely successful investor and entrepreneur in the world of private investment funds, his life story is in fact an very inspiring book for anyone who’s interested in the financial world and investments!
Ray Dalio became famous overnight (disclaimer – he did work his ass off for most of his life when no news channel was caring much about his investment strategies) after the 2008-10 crisis. Why? Because his company – Bridgewater Associates – was one of the very few investment funds that didn’t go flat on its face after the 2008-10 bear market (aka. crisis, as opposed to bull market which would be when the stock prices are roaring up). During the 2008-2010 crisis Bridgewater Associates actually managed an 8% average return! That is shockingly GOOD, considering most investment funds went in the negative :O
According to Ray, the key to the success of this investment fund is in their unique way of balancing their portfolio based on the risk factor each and every financial asset in that portfolio. The risk factors of financial assets are based on macro economic indicators; by monitoring these indicators you can predict which financial assets will (most likely) perform better and adjust your portfolio accordingly. The two main macro economic indicators are growth and inflation. What it is important to know is whether they’re on the rise or fall, because that will affect the performance of your asset categories, i.e. stocks, corporate bonds, treasury bonds and commodities. This table shows you what financial assets perform better in relation to economic growth and inflation.
Growth | Inflation | |
Rising | Stocks | Commodities Inflation Linked Bonds |
Falling | Treasury Bonds Inflation Linked Bonds | Treasury Bonds Stocks |
Apart from the gems on portfolio theory, in Principles you’ll also learn about Ray Dalio’s take on management and life in general! And that’s why the book is called Principles, because he share his principles in life, business and investments.

Yup. There seems to be only 1 rule when it comes to making good investments. This rule is shared by most investor and honestly it’s gonna come as a surprise when you hear it. Admittedly it’s gonna shatter all you knew or thought you knew about investments.
The only rule is…
(and yes, I can share it with you without spoiling the whole book haha)
Weird uh?
Doesn’t that go against the stereotype of the average investor, this guy who has the guts to throw money around and see what happens till he/she gets lucky?!
Despite common beliefs, investors are the most risk adverse people on this planet. But beware – being risk adverse doesn’t mean you don’t take risks. It means you manage risk and (most importantly) you take risks you can afford and try to protect your ass (or in more technical words – your downside :P) as much as you can.
What Rule #1 Investing is telling you is that, in all investments you make, you wanna make sure your principal (as in, the money you invest in the company) is safe. When you cannot do that, you put a cap on the amount of capital you allocate to investments where your principals is exposed to a high risk factor.
Question is – how do you practically do this? You do this by assessing a company with what is called the Margin of Safety method. What you are looking for is a company that has a positive margin of safety. In other words, a company that is worth $100, and you can buy it at $50. That simple.

Alright. It’s getting real here.
This book is 800 pages. Written in the 1930s. One of the heaviest books I’ve read in my life so far. Totally worth it tho!
This book is written (again, what a surprise) by Ben Graham, and his partner Dave Dood. The old version of Buffet and Munger, Dalio and associated. As you can see, investors always work in pairs/groups. Why? You wanna make sure your ideas about a company are properly stress tested to avoid breaking Rule #1. Remember? Don’t lose money!
Security Analysis takes you in a very fundamental journey in the investment world. It does require you to know some of the basic financial terminology and concepts, so definitely not a good book if you’re just getting started in this financial world. In this journey you dive in the fundamental strategies behind investment decisions. Strategies to assess fair prices, intrinsic value, protect your principal, measure and manage risk. Despite their insane levels of success as investors, you notice in this book how humble Ben and Dave had remained throughout their journey as investors. Always looking to challenge their strategies and views on companies.
Don’t forget that this book was written a long time ago, in the 1930s, so some of the examples might not be relevant any more nowadays. However, the principles are timeless. And that’s what you wanna get out of this book and try to apply to your investment decisions today.
So, these were amongst the first books I’ve read on investments. These books not only introduced me to this world but also gave me an insane motivation to get started with my investment portfolio and get better at it. One word of advice, shit that is never clearly communicated to you in school or anywhere else, reading only won’t get you far! Actually, won’t get you any-freaking-where.
Next to learning the basics, you need to take action. This is the only way you’ll internalize this knowledge and get the results you want out of this life.
Like a great mentor of mine always says – Do shit!
Stay up-to-date with the latest developments in the stock and crypto market., fund, and crypto market.
These are unqualified opinions, and this newsletter, is meant for informational purposes only. It is not meant to serve as investment advice. Please consult with your investment, tax, or legal advisor, and do your own research.

In Part 1 of Owner Earnings, we started scratching the surface of estimating a company’s real earnings. Not what they say they earn, under the GAAP net earnings, but the real earnings for the owners. Again, the question we are trying the answer is:
Imagine you owned this company, the whole company, how much money would you be making at the end of the year?
In the example we looked at in Part 1/2, Berkshire acquires the whole company (called Scott Fetzer’s) offering a price that was based on the owner earnings they estimated, independently from the reported earnings. The same approach can be used to estimate a (max) price that is fair to pay for a company on the stock market. Even if you’re just buying 1 single share. It doesn’t matter. The approach remains the same – you wanna know first how much money the company is making and based on that you estimate what a fair price should be.
In my opinion, there’s a few requirements a business has to meet before deserving my support. I’ll share mine in a separate article. For now, let’s look at its earnings only. Which is itself a pretty darn important requirement!
So, where do I start? From a little (not-at-all-little-and-boring-as-hell) collection of documents called Annual Reports.
Annual Reports. Let’s have it.
This is the place where you (are supposed to) find all relevant financial and managerial information about the company you’re interested in. Annual reports are published by every public company as a duty towards their shareholders, who want to be brought up to speed with the latest developments and financial performance. The reports are usually published between 3 to 6 months after the end of a fiscal year (December 31). In other words, they give an overarching picture of what the company when through in a year time, and you as an investor get to take a look in the recent past at financial performance of the company you put your money in!
At the start of the paragraph, I’m saying that you are supposed to find all relevant financial information about a company because… it ain’t that easy. At first. With time, I found my ways around the accounting jargon, endless accounting acrobatics etc etc.
Let me make it easier for you. Here’s two (so called) statements you wanna find in the annual report, rip out (or print, that works too) and keep in front of you while you are trying to figure out prices.
This is probably the easiest and most deceitful one. The income statement is the official profit and loss statement of a company. It tells you how much the company made from the sales of their products and services, how much it made from extra activities (called gains) and how much it spent or loss overall.
Quite clear, isn’t it? Well, no. The income statement can be misleading because of a number of Generally Accepted Accounting Principles (GAAP) that are used to paint a picture of a company’s earnings. Let me give you an example, a simple one.
Imagine you are a 1-man company, investing in the market and selling stocks. In 2019, you made € 100,000 (one thousand euros) from commissions on the stocks you sold. I’m talking cold hard cash in your pockets from selling stocks. At the start of 2019 you also owned € 100,000 worth of shares in the stock market. By the end of 2019, that money accrued (fancy term to say growed) to € 150,000. This is not cash in your pocket, just the value of your account by December 2019 grew by € 50,000 to € 150,000.
According to GAAP, when you publish your annual report for your 1-man company, you will have to report the €50,000 as net earnings?! What?! Yes. Even if it’s not in your pocket.
It gets even weirder when you imagine what happens if the economy crashed and the worth of your account is suddenly € 0, in which case you “lost” € 100,000. Officially, your 1-man company would have € 0 earnings. While there’s € 100,000 in sales commission in your pockets.
OK, I know. This is waaay oversimplified and extreme. It just goes to show how misleading the GAAP earnings can be when it comes to understanding the financial situation of a company.
But let’s go back to the income statement. What do we take from this? What’s important here?
From the income statement, you want to highlight and write down these three pieces of info:
Equivalently, instead of net income + income tax you can also note down directly the pre-tax income.
Little side note here, if your reaction to weighted average of common shares was – WTH did you just say? It’s okay. For now, I’ll tell you what you need to know – this is the number of shares available to purchase on the stock market. Why the fancy name? We’ll talk more about this in a later article!
All clear so far? Let me recap, before we move on.
That’s it. Next statement – Cashflow.
This is probably the most important statement you need to look at in an annual report. Here you see exactly how much cash has come in and out of the company. In general, using $20 words, what puts cash in your pocket is something called assets. What takes it out of your pocket is a liability. Period. You can find countless more poetic description selling at $2,000 per syllable, but the core of it is just this simple.
Asset = Anything that puts money in your pocket
Liability = Anything that takes money out of your pocket
There’s plenty of things to say about these two guys. But let’s keep it to this for now. And know that the movements of cash are captured in the cashflow statement. Without further a due, let’s get to what’s important from this statement. Here the list is a little longer. Bear with me, I’ll break it down for you.
This is what you want to remember from this statement:
Let’s look at them one by one and understand what these numbers are telling us.
When explaining the cashflow statement, I mentioned that it captures the cash movements coming from, amongst other things, the company’s assets. Assets are resources owned by the company. Apart from generating cash for the company, these resources can lose, maintain or increase in value over the course of a year. The net difference is what we’re interested in and this value if found in the cashflow statement.
Examples of assets are properties (i.e., real estate owned by the company), technology components, proprietary resources etc.
Account receivables is accounting jargon for money you still need to receive from your customer for services you have already provided or products you have already sold.
Example, a company selling pasta sells a total of 2,000 kg to a big restaurant. They send the invoice for €20,000 and request payment within 90 days. Imagine the fiscal year ended before that, or for some reason the restaurant delayed the payment, €20,000 will be carried in the annual report of the pasta company as account receivables in 2020.
However, what we’re interested in is the net difference between 2019 and 2020. Imagine this scenario, the pasta company carries €10,000 in account receivables from 2019, and €20,000 from 2020. In this case, it effectively lost €10,000. This net difference is what you’ll find in the cashflow statement and what you should pay attention to.
Payables are money the company owes to its suppliers. Back to the pasta company. To produce the 2,000 kg of pasta for their client (the big restaurant chain), they bought in €5,000 worth of flour from their supplier. Since they give their clients 90 days to pay for the pasta, they ask their suppliers 180 days to pay the invoices. The fiscal year has ended, the restaurant has delayed their payment, and you also didn’t pay the flour supplier.
In your annual report, next to the €20,000 carried as account receivables (in $20 words – the restaurant still hasn’t paid), you carry €5,000 in account payables (as in, I still haven’t paid for the flour).
Once again, we are interested here in the net difference between 2019 and 2020. Imagine in 2019 you carried €1,000 in payables. As you know, in 2020 it became €5,000. So, in terms of cash flow you gained €4,000. This money is still sitting in your accounts, since you haven’t paid it our yet.
Purchase of property and equipment, also called total capital expenditures, tells you how much money the company has invested to grow and maintain its operations. If you’re a company making pasta, your capital expenditures will most likely be new machineries to produce pasta and increase your volume, new facilities perhaps in new countries, maintenance of existing factories etc.
This is an important number, where a lot of accounting tricks can be applied to. From the total capital expenditures, you are interested in the part related to maintenance. Why? Without taking into account money you invest to finance your growth, you want to know how much money the company spends annually to sustain its operations and maintain its volume. This amount is called maintenance capital expenditures, quoting a great investor and mentor of mine: Phil Town (author of Rule #1 Investing).
So, how do you get this number?
I have to say this is a tough one. Here’s how I approach it.
Step 1 – Sometimes companies break down the total capital expenditures in the cashflow statement. In this case, you can pick and choose the components you want to include in the maintenance capex. Oh yeah, capex is the cool way of saying capital expenditures.
Step 2 – I look for explanatory notes in the annual report related to the total capital expenditures. Sometimes, if the total capex is not broken down in the cashflow statement, you find a lot of useful information in fine print and explanatory notes that allow you to estimated maintenance capex.
Step 3 – If Step 1 and Step 2 don’t tell me anything useful, I take the full total capex as my maintenance expenditures. This is my last resort. By doing so, I am estimating a more conservative price for the company which means I’m NOT losing money.
After all, quoting Buffet here, that Rule #1 in investing – DO NOT LOSE MONEY.
I promised you all this talk about annual reports will help you estimate the owner earnings, the famous metric to estimate what a company is making for its owners mentioned in Berkshire’s1986 letter to shareholders.
Good news is, with all information collected from the annual report, you can now estimate the owner earnings, and a “fair” price you’d be willing to pay for the company. How? Like so.
Owner Earnings | = |
Pre-tax income | + |
Depreciation and amortization | + |
Account payables (net) | + |
Account receivables (net) | + |
Maintenance capex |
Note that some of these quantities may be negative!
Let’s take some rest now! We’ve covered a lot in this article despite the fact that there’s one missing piece in this whole story – what is the price of the company? How much money should I pay for this company?
I will answer that question in a different article, fully dedicated to using owner earnings to calculate price! So, you’ll finally know what to do with a number I asked you to note down but haven’t used yet – the weighted average of common shares.
Stay tuned! And celebrate because understanding annual report is an important part of your journey to a successful investment!
Stay up-to-date with the latest developments in the stock and crypto market., fund, and crypto market.
These are unqualified opinions, and this newsletter, is meant for informational purposes only. It is not meant to serve as investment advice. Please consult with your investment, tax, or legal advisor, and do your own research.